


The Importance of Understanding Bitcoin Price Chart Patterns
In the ever-evolving world of cryptocurrency, grasping the dynamics of Bitcoin price chart patterns is essential for traders and investors. Millions of dollars are exchanged daily, and with that comes volatility and uncertainty. Did you know that in 2024 alone, nearly $4.1 billion was lost to DeFi hacks? With such staggering figures, having the ability to anticipate price movements becomes imperative.
Understanding these patterns not only enhances your trading abilities but also minimizes risks associated with this volatile asset class. As Bitcoin continues to dominate the cryptocurrency market, spotting trends and recognizing key price formations can be incredibly beneficial.
What Are Chart Patterns?
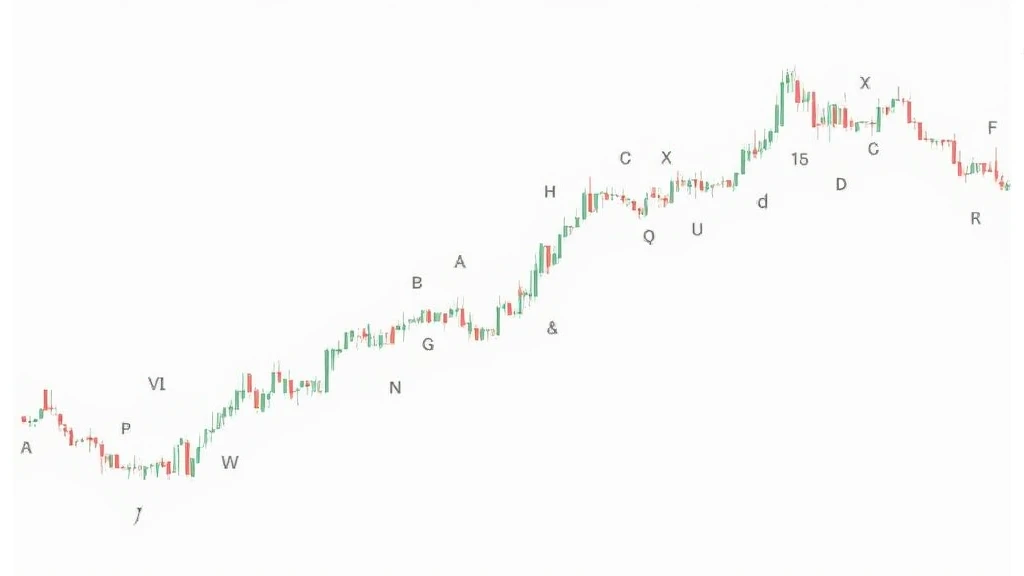
Chart patterns are formations created by the movement of prices on a chart, which traders utilize to assess potential future movements of an asset. Just like how architects visualize their blueprints, traders use price charts to predict the direction of Bitcoin’s price based on historical behavior.
- **Reversal Patterns**: Indicate that a trend is about to change direction.
- **Continuation Patterns**: Suggest that a trend is likely to continue after a brief pause.
- **Indecision Patterns**: Show uncertainty in the market.
Key Bitcoin Price Chart Patterns to Watch
Recognizing specific patterns can help traders make more informed decisions when buying or selling Bitcoin. Here are some commonly observed price chart patterns:
1. Head and Shoulders
This pattern consists of three peaks: a higher peak (head) between two lower peaks (shoulders). The head and shoulders pattern is often a strong indicator of a market reversal. After the formation, the price tends to decline, which provides a clear signal to sell.
2. Double Tops and Bottoms
Double tops are formed after an asset reaches a peak twice with a moderate decline between the two peaks. This pattern indicates that the price may start to drop. On the contrary, double bottoms form after a price decline, suggesting a potential bounce-back in prices.
3. Flags and Pennants
Flags are short-term continuation patterns that resemble rectangles, while pennants look like small symmetrical triangles. Both patterns indicate that a trend is likely to continue. They form during strong upward or downward movements, which traders should pay attention to.
4. Triangles
Triangles can be classified into ascending, descending, and symmetrical varieties. They indicate periods of consolidation before a price breakout occurs. Understanding these can assist traders in anticipating upcoming market movements.
Utilizing Patterns for Effective Trading Strategies
Once you are familiar with various Bitcoin price chart patterns, aligning them with a solid trading strategy becomes essential. Here’s how:
- **Set Clear Entry Points**: Identify where you want to enter a trade based on confirmed patterns.
- **Establish Stop-Loss Levels**: Protect your investments by setting a maximum loss threshold.
- **Determine Target Prices**: Use previous resistance or support levels to identify exit points.
Understanding the Vietnamese Market: User Growth Trends
In a global context, Vietnam has shown significant growth in its cryptocurrency market, with increases in users of up to **30% year-over-year**. This growth presents ample opportunities for investors in the region to leverage Bitcoin price chart patterns effectively.
As Vietnamese traders become more familiar with cryptocurrency trading, the understanding of Bitcoin price patterns could lead to greater market stability and informed trading decisions. For instance, with more local exchanges and trading platforms catering to the Vietnamese market, trading becomes even more accessible.
Real Data on Historical Bitcoin Price Movements
To further underscore the importance of Bitcoin price chart patterns, we compiled data from the last five years, showing key price movements:
| Year | Average Price (USD) | Notable Price Patterns |
|---|---|---|
| 2020 | ~$7,200 | Double Bottom Pattern |
| 2021 | ~$47,000 | Head and Shoulders |
| 2022 | ~$19,000 | Bear Flag |
| 2023 | ~$30,000 | Ascending Triangle |
| 2024 | ~$25,000 | Double Tops |
Conclusion
In summary, understanding Bitcoin price chart patterns remains a critical aspect of successful trading in today’s dynamic market. From predicting price movements to managing risk, being equipped with this knowledge significantly enhances your trading capabilities.
As you embark on your trading journey, remember to combine these patterns with insightful trading strategies, and keep a close eye on the opportunities emerging from the Vietnamese market. The knowledge you gain today can position you for success in the rapidly growing world of cryptocurrency.
For more insights and updates, be sure to follow platforms like hibt.com, where you can deepen your understanding of the market.
Expert Author: Dr. Minh Nguyen, a renowned financial analyst with over 15 published papers in the field of cryptocurrency trading strategies and audit reviews of several high-profile blockchain projects.